While testing my laptop’s microphone on Linux, I heard sharp static noise instead of my voice but the microphone wasn’t broken. The problem was a format mismatch between raw audio streams. This guide walks through proper Linux microphone debugging: why file recording works when live pipes don’t, how PipeWire differs from ALSA, and the tools (pw-top, pavucontrol) that reveal what’s really happening in your audio stack.
Context
While testing my laptop’s microphone on Linux, I heard sharp static noise instead of my voice but the microphone wasn’t broken. The problem was a format mismatch between raw audio streams. This guide walks through proper Linux microphone debugging: why file recording works when live pipes don’t, how PipeWire differs from ALSA, and the tools (pw-top, pavucontrol) that reveal what’s really happening in your audio stack.
Understanding the Modern Linux Audio Stack
For the sake of context we won’t go into so many details. Abstraction sometimes is important, so we’ll just deal with what you need to know whether you’re well resourced or not.
The Linux audio stack can seem complex but actually it isn’t, unless you’re playing on revolutionising the whole architecture.
The modern Linux audio stack is a layered, modular system designed to manage audio input and output efficiently while supporting a wide range of use cases—from basic desktop audio to professional music production. On most current Linux distributions, PipeWire has become the default audio (and video) server, unifying the functionality of earlier systems like PulseAudio and JACK.
If you want to know more about PulseAudio and Jack and even the rest to have a more historical context here’s an article for you 👇🏼
Breaking Down the Linux Audio Stack

Since PipeWire is the recent one used till today and almost all if not all on Linux distros, we’ll be focusing on it as well as ALSA.
This brings us to an question: what’s PipeWire? Well let’s unpack what ALSA is first, then PipeWire will become easier to comprehend.
Here’s a Modern Linux Audio Stack Overview

About ALSA
The Advanced Linux Sound Architecture (ALSA) is a software framework and part of the Linux kernel that provides an application programming interface (API) for sound card device drivers. It has direct access to every audio hardware(sound cards, onboard audio, USB microphones etc).
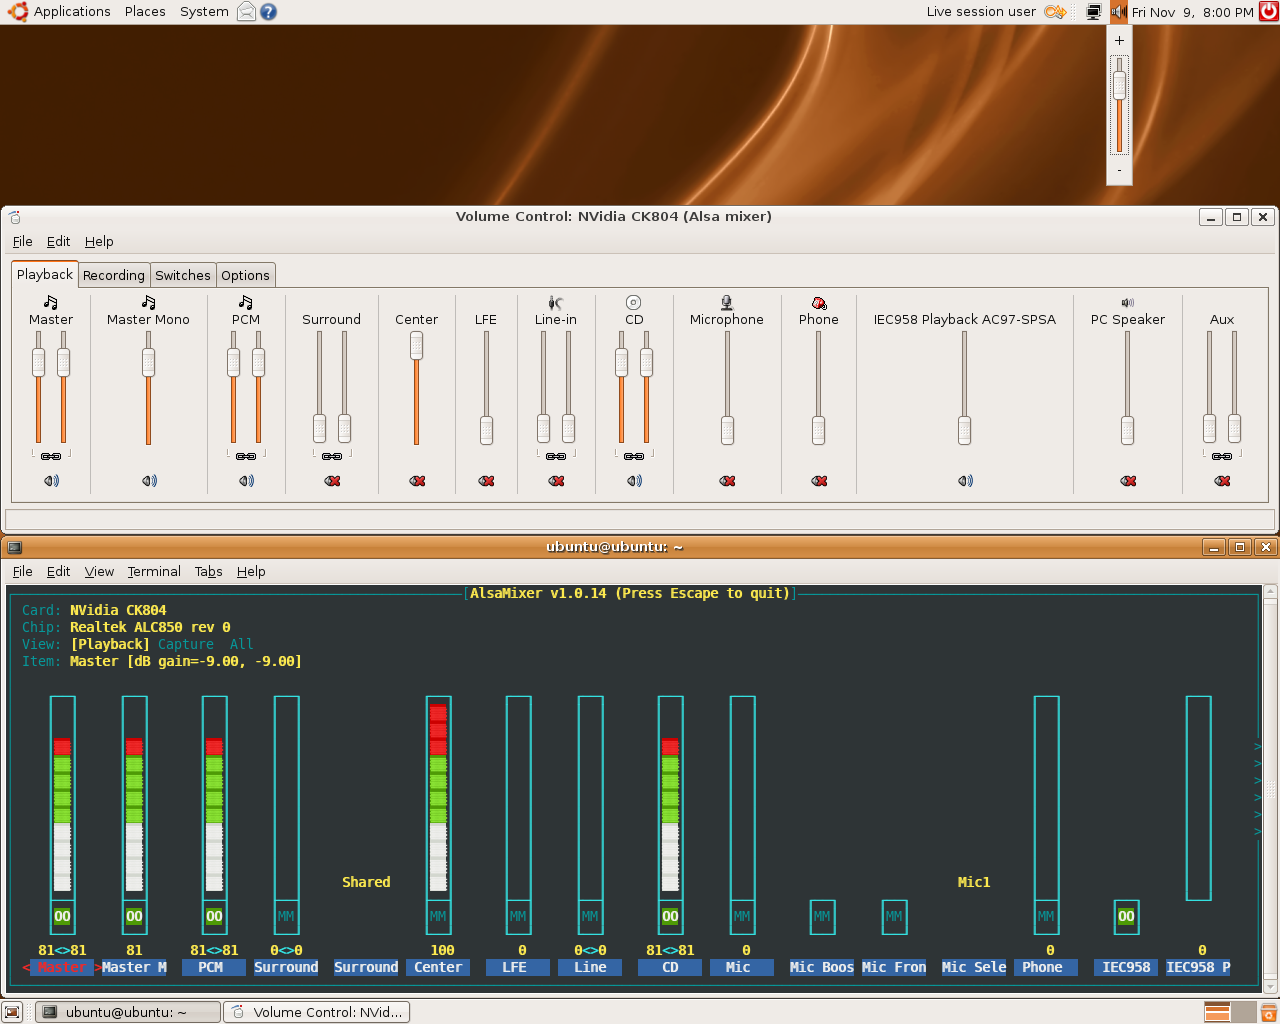
Here’s an Alsa Mixer from Ubuntu
Here’re some of its functions:
- Loading and managing hardware drivers (snd_hda_intel, snd_usb_audio, etc.)
- Exposing audio devices via /dev/snd/
- Handling raw PCM data, sample rates, buffer sizes
- Providing basic mixing and routing through plugins like dmix or dsnoop
Retain that if your app is able to use the mic, it had to be connected to it and thanks to ALSA you can first see and then access it.
Tools like arecord, aplay, and alsamixer enable us to interact with ALSA directly. We shall see how to use them
The only obvious limitation with it is that ALSA alone doesn’t support per-application volume control or network streaming—higher-level servers are needed for that.
that’s where PipeWire comes
About PipeWire
PipeWire sits between applications and ALSA, acting as a modern replacement for both PulseAudio (for general desktop audio) and JACK (for low-latency pro audio).
So everything multimedia data is managed by PipeWire.
Thanks to it, you can be recording something while watching your movie and doing other things linked to either audio or video, or both.
For short, it’s a graph-based multimedia framework designed to handle audio, video, and MIDI streams with low latency and high efficiency on Linux systems.
The fundamental building blocks of PipeWire are nodes and links within a graph structure.
Nodes represent media sources (e.g., microphones, webcams), sinks (e.g., speakers, headphones), or filters (e.g., audio effects). Each node has one or more ports—input or output points—through which data flows.
Links connect output ports of one node to input ports of another, forming the data path through the graph.
Data flow is managed by the PipeWire daemon, which executes the graph and enforces real-time constraints, while higher-level decisions like routing and device management are delegated to a session manager.
I know some words or the entire definition might sound like a jargon to you, but as soon as we start using the commands and tools and demos you’ll understand better.
Its key features:
- Low-latency performance comparable to JACK
- Full PulseAudio API compatibility (existing apps work without changes)
- JACK-compatible API for DAWs and pro audio tools
- Secure handling of audio in sandboxed apps
- Support for both audio and video streams
- Graph-based routing: applications, inputs, and outputs can be freely connected
Tools like pw-record, pw-dump, qpwgraph, and more enable us to communicate with PipeWire
Debug and Discovery time
1. Snapshot-based debugging
In case you ask what it is, snapshot-based debugging is the practice of capturing a complete, immutable snapshot of a system’s state at a specific moment in time, and performing diagnosis offline by analyzing, comparing, and reasoning about that snapshot.
Note: you can open the screenshots on another tab to clearly see what’s being done.
This snapshot-based debugging is used in almost every troubleshooting or closer diagnose of the object of study.
Here’re some instances:
System Snapshot
- Linux kernel ( /proc, /sys, vmcore )
- Filesystems ( LVM snapshots )
- Databases ( transaction logs )
- Kubernetes ( kubectl get -o yaml )
- Systemd ( systemctl dump )
In our case here we’ll be using this command for a closer look at PipeWire
pw-dump
pw-dump is not a step debugger like gdb. It’s a state introspection + graph snapshot debugger.
It answers questions like:
- What objects exist right now?
- What formats are negotiated?
- What ports are connected?
- What policies were applied?
- What nodes are suspended / running?
- What properties were auto-injected by WirePlumber?
This is similar to:
- /proc/*
- sysfs
- bpftool dump
- ls -l /sys/kernel/debug
Now, if you run the command it’ll output the entire json state-code of PipeWire at that very TIME. Usually this command isn’t the first one to run, and also the best way to take a closer look at it due to its length (about 6000+ lines of code), is to save it to a file and from there analyse it closely.
When you run that command it tells PipeWire “Show me every object you know about, with all properties, permissions, and state.”
The output is JSON, where each top-level object represents one PipeWire object:
- Core
- Modules
- Factories
- Nodes
- Clients
- Metadata stores
Each object has:
- an id
- a type
- permissions
- info / props
- sometimes params or metadata
Seeing the length of the output you wouldn’t want to analyse there rather in a file
use can use the following command to save it in a file:
pw-dump > snapshot.json
you can give the file any name you want, then use any text editor of your choice to open it. I’m using vim for the entire analysis(only for this particular debugging).
The first section of the code you’ll see contains every vital and first information about PipeWire daemon itself and other information about your system.
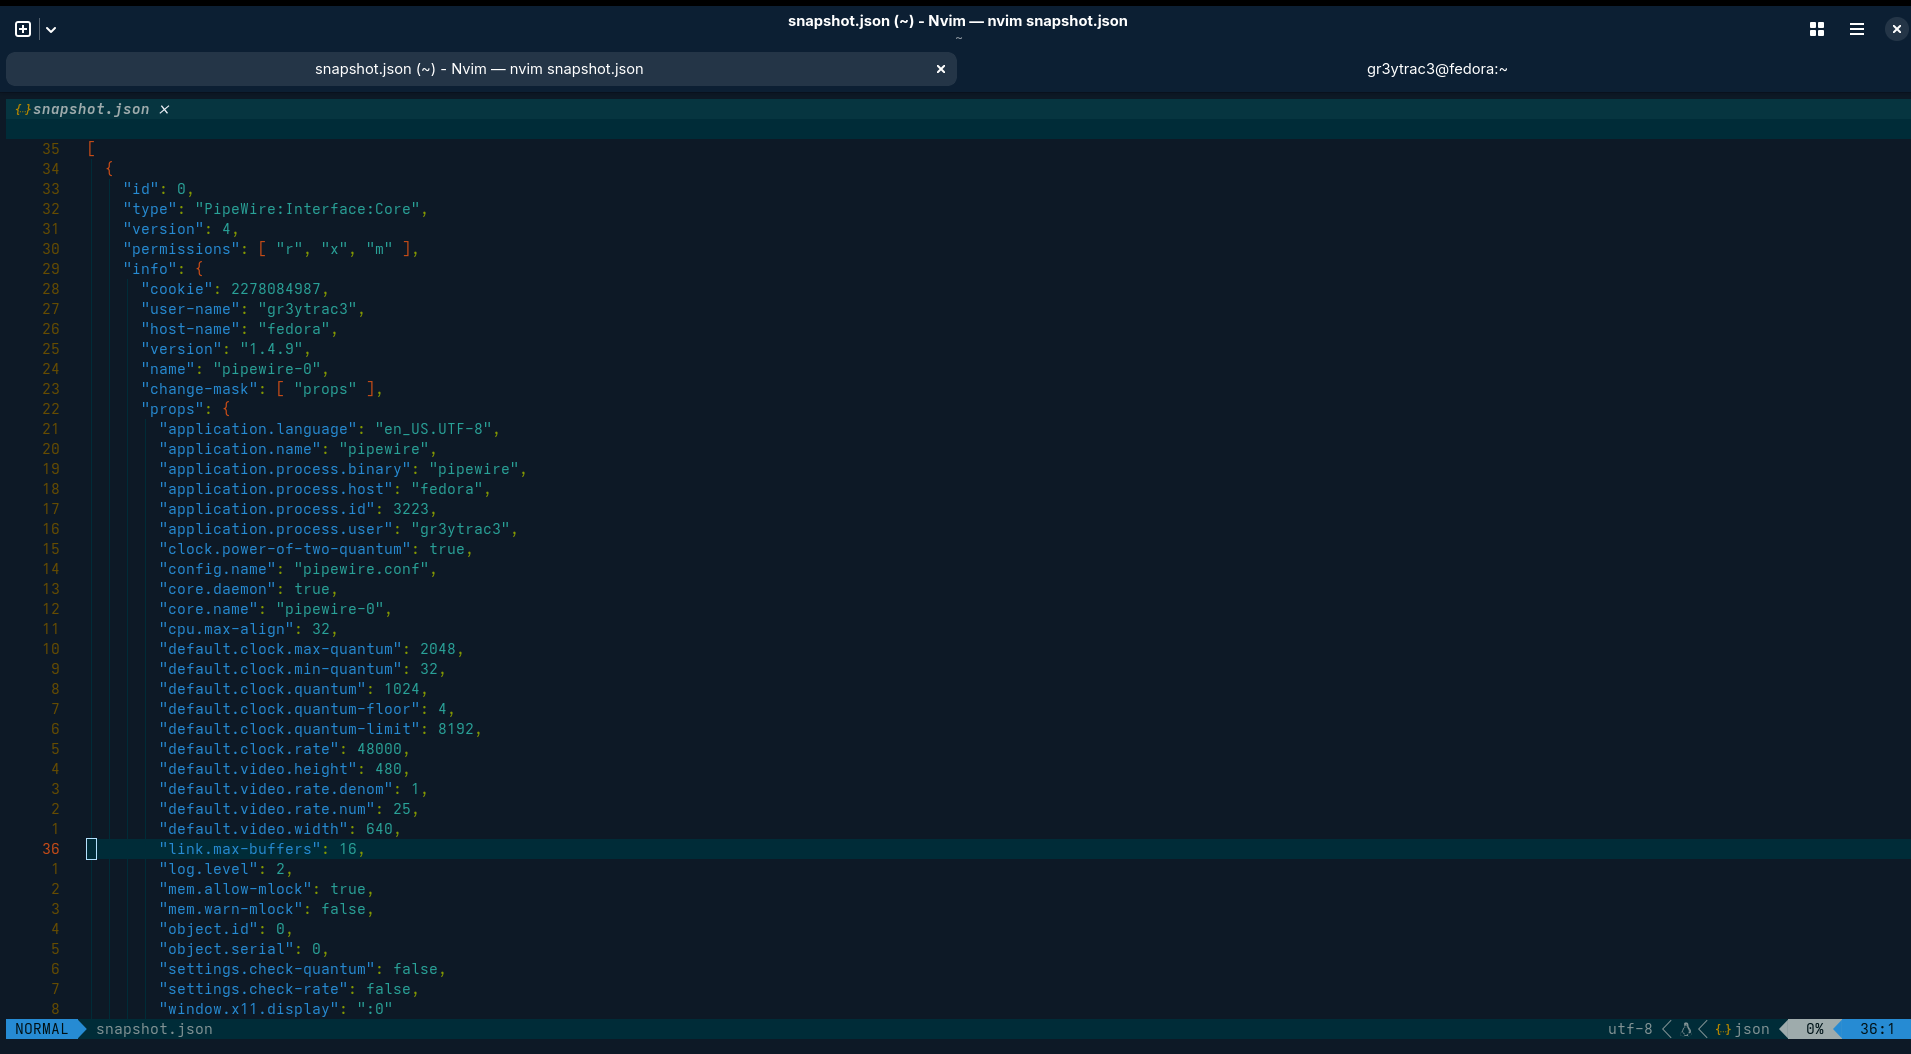
Key fields:
- application.name: pipewire
- version: 1.4.9
- default.clock.rate: 48000
- default.clock.quantum: 1024
Meaning
- 48kHz sample rate
- 1024 frames per quantum → latency ≈ 21.3 ms
- This clock drives everything (audio & video)
This explains why tools complain if you try incompatible formats/rates.
Note that the PID (process ID) is fixed. You can see it on the following figure.
Unlike common processes, some component use FIXED PIDs to avoid conflicts with other processes and also to enable the kernel to properly identify them.
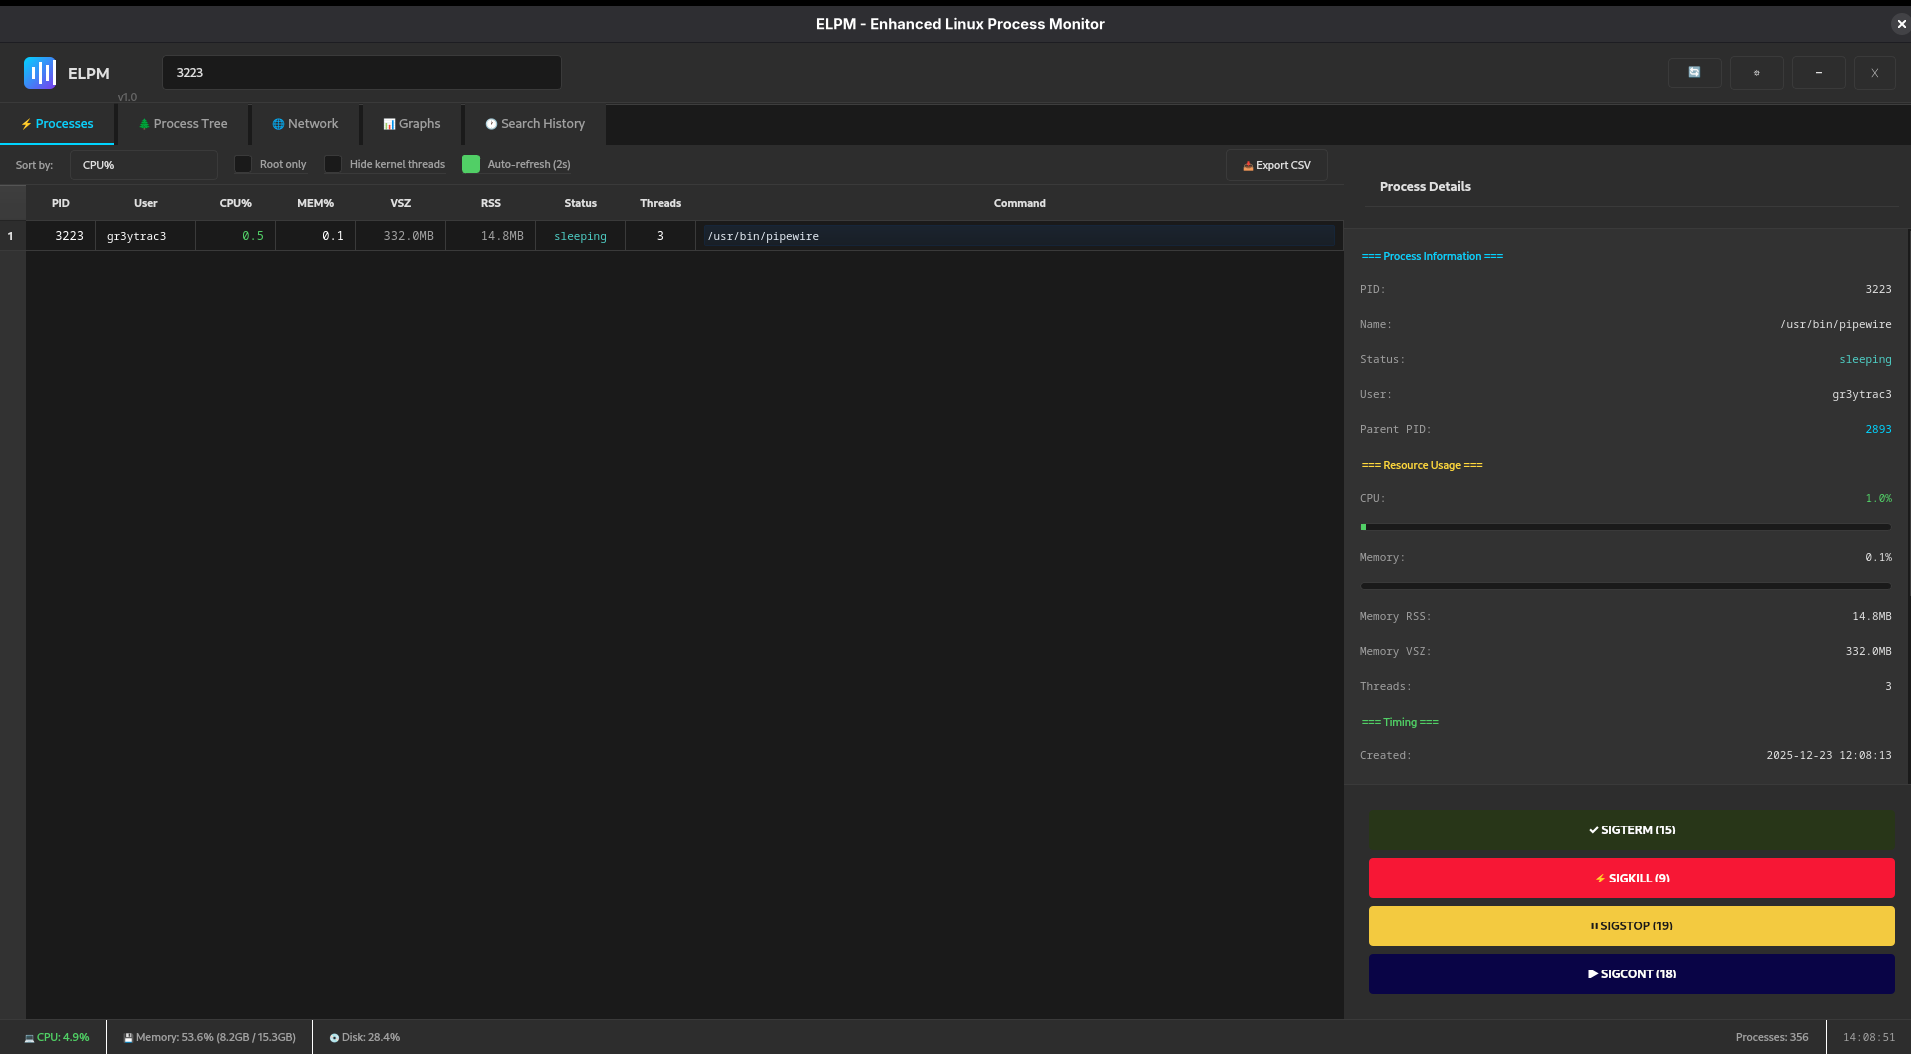
Now i’d like to draw your attention to the user there. You can see that applications at the userspace can use it, as well as the user (by default)
But what of ALSA? check out the following figure

can you see the user there? Root and where is it located?
Here
/usr/sbin/alsactl -s -n 19 -c -E ALSA_CONFIG_PATH=/etc/alsa/alsactl.conf --initfile=/lib/alsa/init/00main rdaemon
For the sake of abstraction we won’t go into explaining every command there. You can make more research about that whenever you wish. This was just to show that ALSA and PipeWire aren’t on the same level in the Linux architecture.
alsactl
ALSA control utility, manages mixer state, not audio streams.
It handles:
- Volume levels
- Mute states
- Jack detection
- Power-save states
- Restore-on-boot behavior
here’s the mixer
BACK TO DEBUGGING
Now when debugging you’ll usually be dealing with PipeWire, rarely ALSA. However it’s still possible the source of the issue might be from ALSA but that will be confirmed by PipeWire upon troubleshooting it.
There’re many cases of audio and video failure, hence I’ll just take one of the most common one (on audio).
You know that moment when your playlist is going on but you suddenly noticed that either your front-left or front-right speaker isn’t working. Even happened to you?
You even go as far as taping your laptop thinking it’s coming from the hardware, well in most cases it isn’t , at least you can’t really tell so long as proper analysis have been done.
Or those apps that just wouldn’t output sounds, as if they weren’t built to output sounds. The weird part is that they require to access your mic which you did but nothing. You get angry, but in reality It’s the apps fault. Some manual configs have to be done for the sound to either be established or restored (in case one front speaker isn’t working).
Another case is when you suddenly realise that your voice isn’t that audible despite increasing the volume input to its top. That pisses off right? Well it’s also not really the mic’s fault nor the sound hardware’s fault at least not, as long as PipeWire haven’t been thoroughly analysed.
You must have experienced either of these upsetting experience or any other.
We’ll be using few other tools and techniques to effectively debug these audio issues.
Video issues too exist but not as audio, however the same techniques can be used to check for video renderings.
We’ll as well talk about the security aspect of this briefly, in the end of the write-up.
Let’s Begin
We’ll only focus on 5 ways to debug ,find and fix issues and how to out for them next time and also how you can keep your eye on them in case of unusual things from your mic.
1. Snapshot-based debugging (a closer look)
Before you go one, let me clarify something here, you may think that you’re to go through this whole bunch of code that you probably have no idea about: NO
There’re essential sections that carry crucial information that tells you about the state of your audio input and output, even video (not really covered here).
So here’s an easy way to go straight to the point and get your result.
Everything is categorised, hence by checking the category and what they tell you, you can narrow down the issue and get it solved.
Category—> What it tells you
Core—> global truth
Module—> features
Factory—> capabilities
Node—> signal
Client—> ownership
Metadata—> policy
Filter, don’t scroll
You can use tools like jq to ask questions where you should.
Just two examples:
1.Retrieves and filters the JSON output from the pw-dump utility to display only the objects that are of type “PipeWire:Interface:Node”
pw-dump | jq '.[] | select(.type=="PipeWire:Interface:Node")'
2.Extracts the node.name property from every object in the pw-dump output, regardless of its type.
pw-dump | jq -r '.[] | .info.props."node.name" // empty'
You can see in the figure below how it returns the current PipeWire state in real time. I was playing a song on Youtube at that moment, then paused it for you to see how it goes off few seconds from PipeWire.
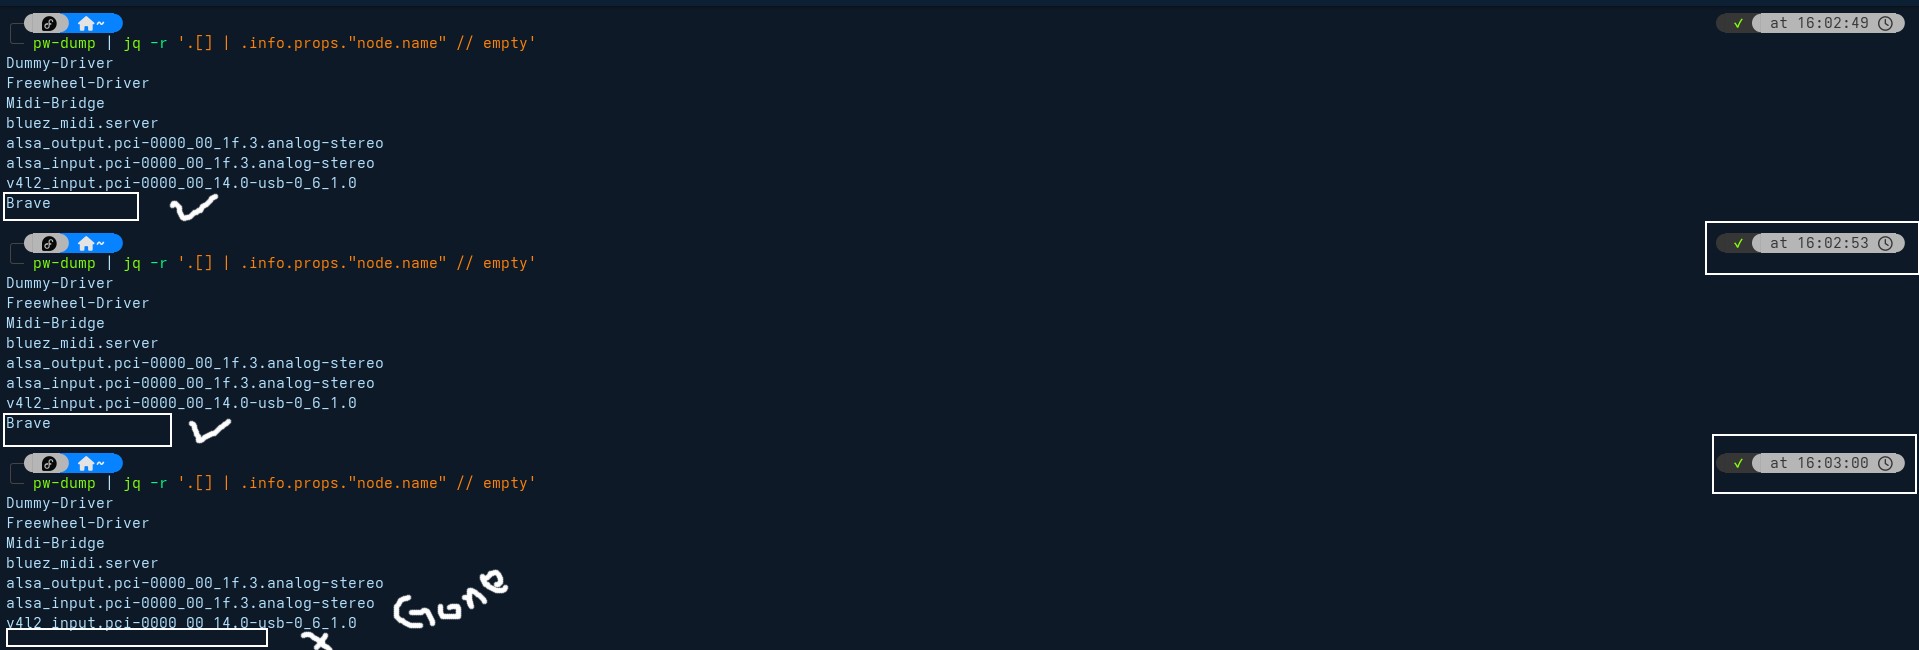
You can view and manipulate this in real time using qpwgraph. We’ll come to that soon.
Common things to check first (PipeWire-specific)
Top 10 checklist
- Default sink/source
- Node state (running vs suspended)
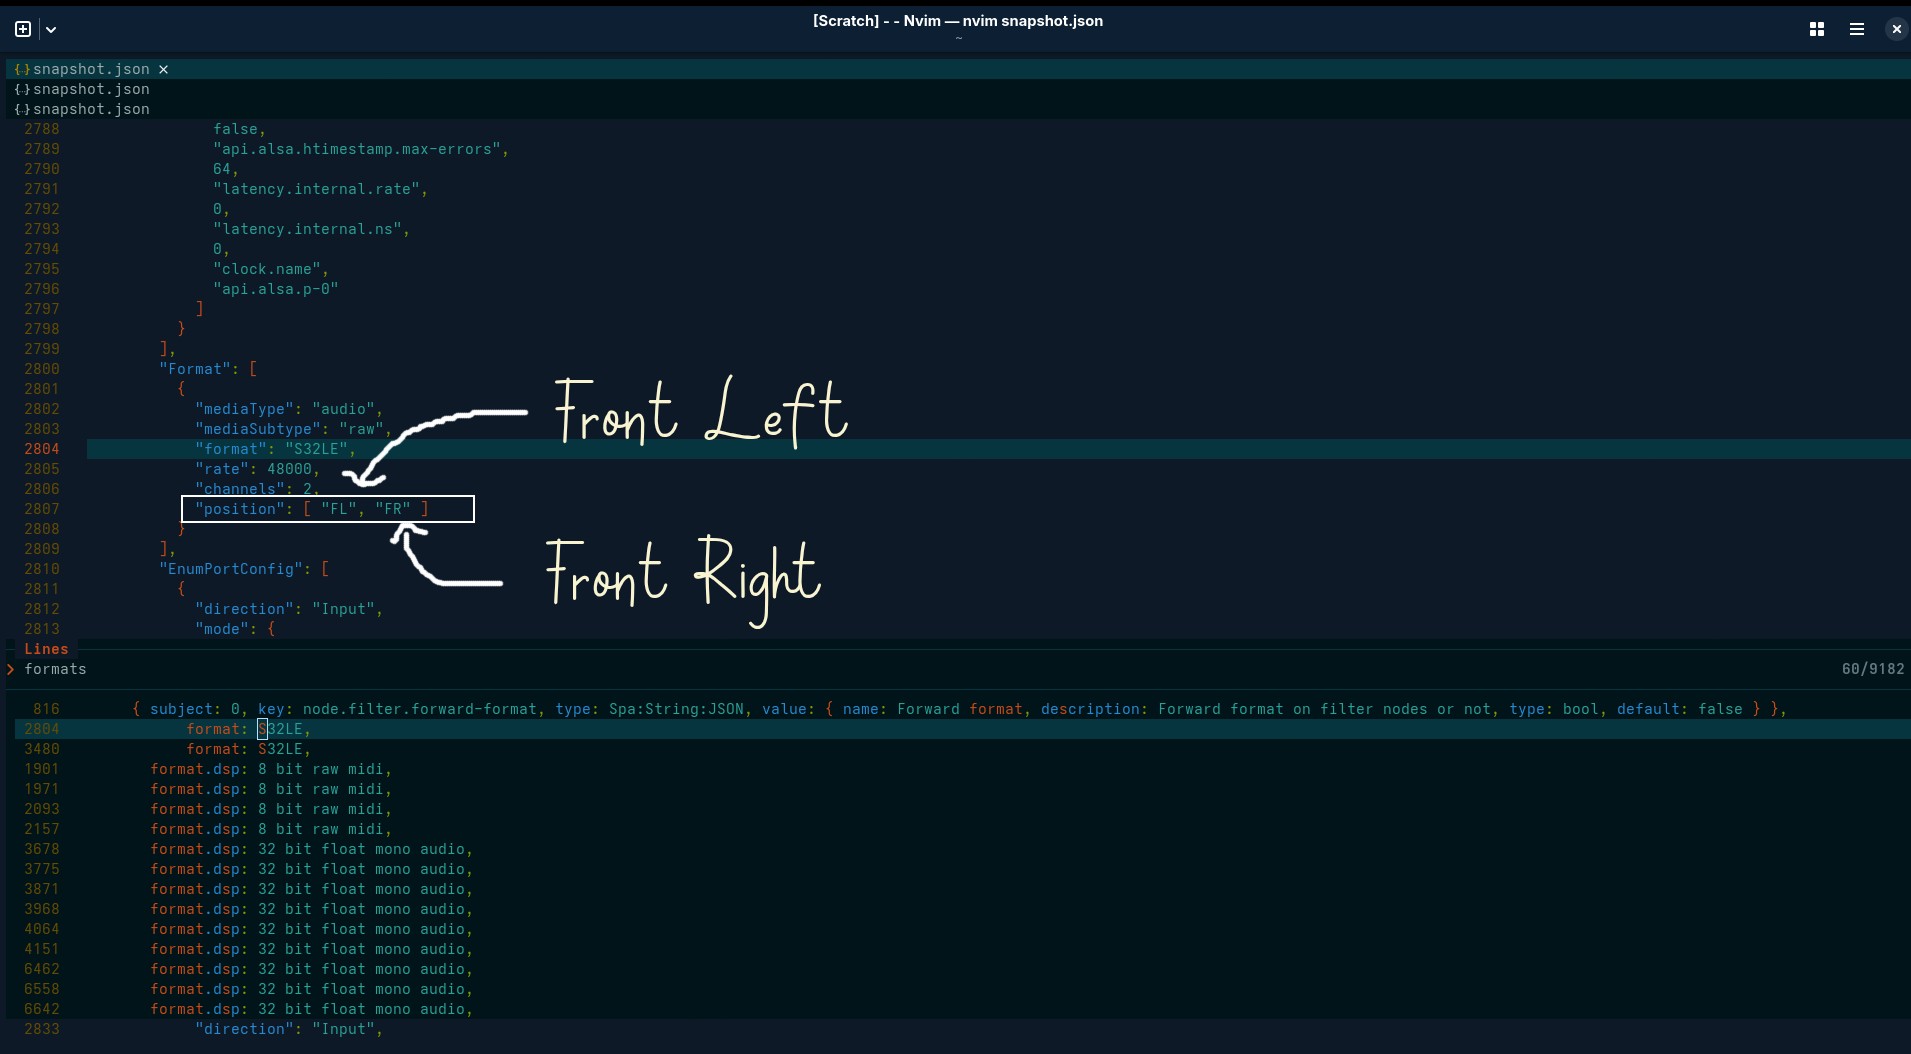
- Format mismatch
- Sample rate mismatch
- Channel count mismatch
- Permissions
- Clock provider
- Monitor vs capture confusion
- Policy overrides
- Autolink assumptions
My issue was the 8th.
Now Let’s say it’s an issue with on of your front speakers.
3 ways and how to reconnect them back
The first thing is to verify if they even appear in PipeWire by searching for them to see if they appear in the PipeWire json file.
You can as well run the following command:
Though it’s to control of the mixer for the ALSA soundcard driver via the CLI, but ours it to be sure that either of the front speakers are present and “ON”.
amixer
It may be that amixer fail at indicating which one is OFF and ON, do not worry. it wasn’t designed to give such information but to regular the volume. However, we have a certainty that the issue isn’t from the hardware because ALSA is directly connected to the audio hardware which means that if our front speakers weren’t ON, then the root cause would be obvious and put an end to our analysis.
If both speakers are ON, then we have two ways left to check and surely restore the sound and redirect it to the correct front speaker.
Testing sound along with our final tool: qpwgraph
start with testing the speakers straight from the hardware using File-Based Recording
pw-record /tmp/test.wav
Speak for a few seconds, then stop the command (Ctrl+C) and play it back using the following command:
pw-play /tmp/test.wav
If it works then you can be assured that the issue isn’t from your hardware. This is form of test without having to physically access your hardware system to operate on it or test.
Another test is to try listening to yourself in real time as you speak
pw-record --raw --format s16 --rate 48000 --channels 2 -|pw-play --raw --format s16 --rate 48000 --channels 2 -
If you hear your voice clearly, this confirms:
✅ The microphone hardware works
✅ PipeWire routing is correct
✅ Input volume and permissions are properly configured
✅ Real-world audio capture functions as expected
Advanced Debugging Tools
qpwgraph
qpwgraph is a free, open-source graph manager for PipeWire. It provides a visual interface to manage and route audio (and video) streams between applications and devices on Linux systems using PipeWire, similar in design and functionality to QjackCtl.
You can easily install through CLI. Here’s in fedora
sudo dnf install qpwgraph
To install it on Debian and Ubuntu
sudo apt install qpwgraph
It’s available in the official repositories for recent versions. For older Ubuntu releases, you may need to add the PPA:
sudo add-apt-repository ppa:rncbc/apps-jammy
sudo apt update
sudo apt install qpwgraph
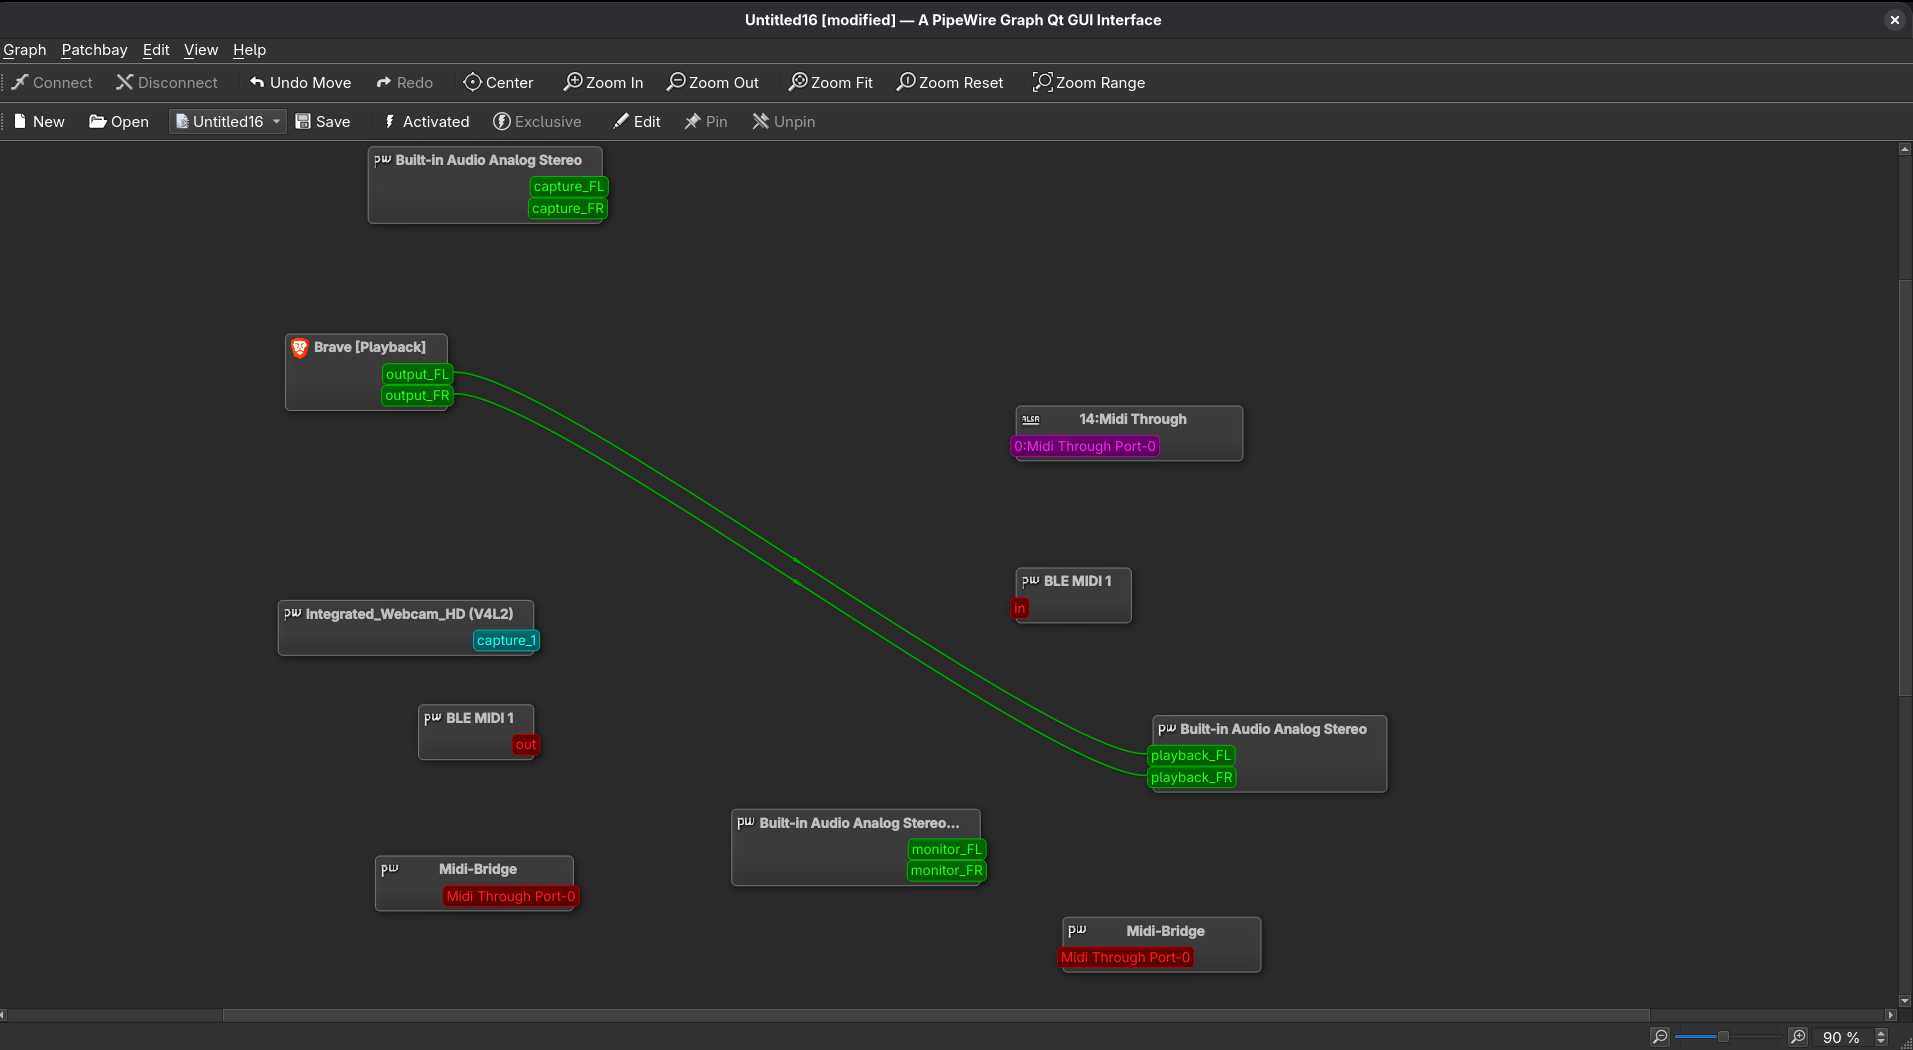
The below figure is how it displays by default.
You can check out this tutorial on how it works to get more familiar with the interface: Qpwgraph Tutorial
For more information and guidance on it, check it here: qpwgraph
Here’s a short demo, but if you want to see a more practical one, I posted one here:
Basically, once you run the tool, just play whatever thing you were playing and if it’s the front-right (FR) or the front-left(FL) that isn’t connected you can just drag it it from one input to the output and the other way round. What you can’t do is to connect from one output to another output, same for inputs. You can have found rerouting sound nodes to another source. It’ll just create some distortion and unpleasant sounds.
There’re so many things you can do with it. Feel free to make more research and discover new stuffs.
pw-top: Real-Time Audio Monitoring
pw-top is similar to top or htop, but for audio. It shows:
- Active input (source) and output (sink) nodes
- Real-time processing activity
- Buffer performance and latency
- Whether the microphone is actually being used
Use this command
pw-top
This is what you should see
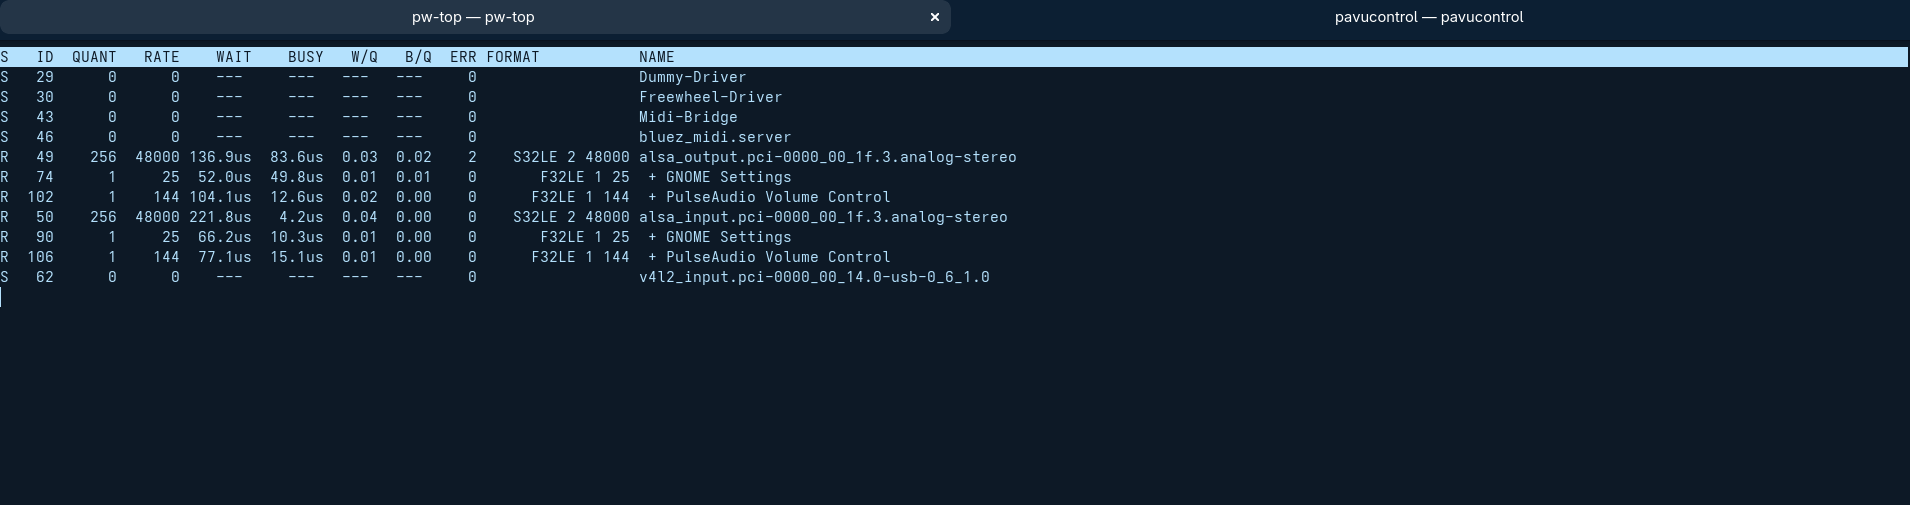
Here’s a quick demo
While speaking into your microphone, look for:
- Increased BUSY values on source nodes
- Changes in W/Q (work per quantum)
- Active processing indicators
If values change when you speak, the microphone is actively capturing audio.
Final tool
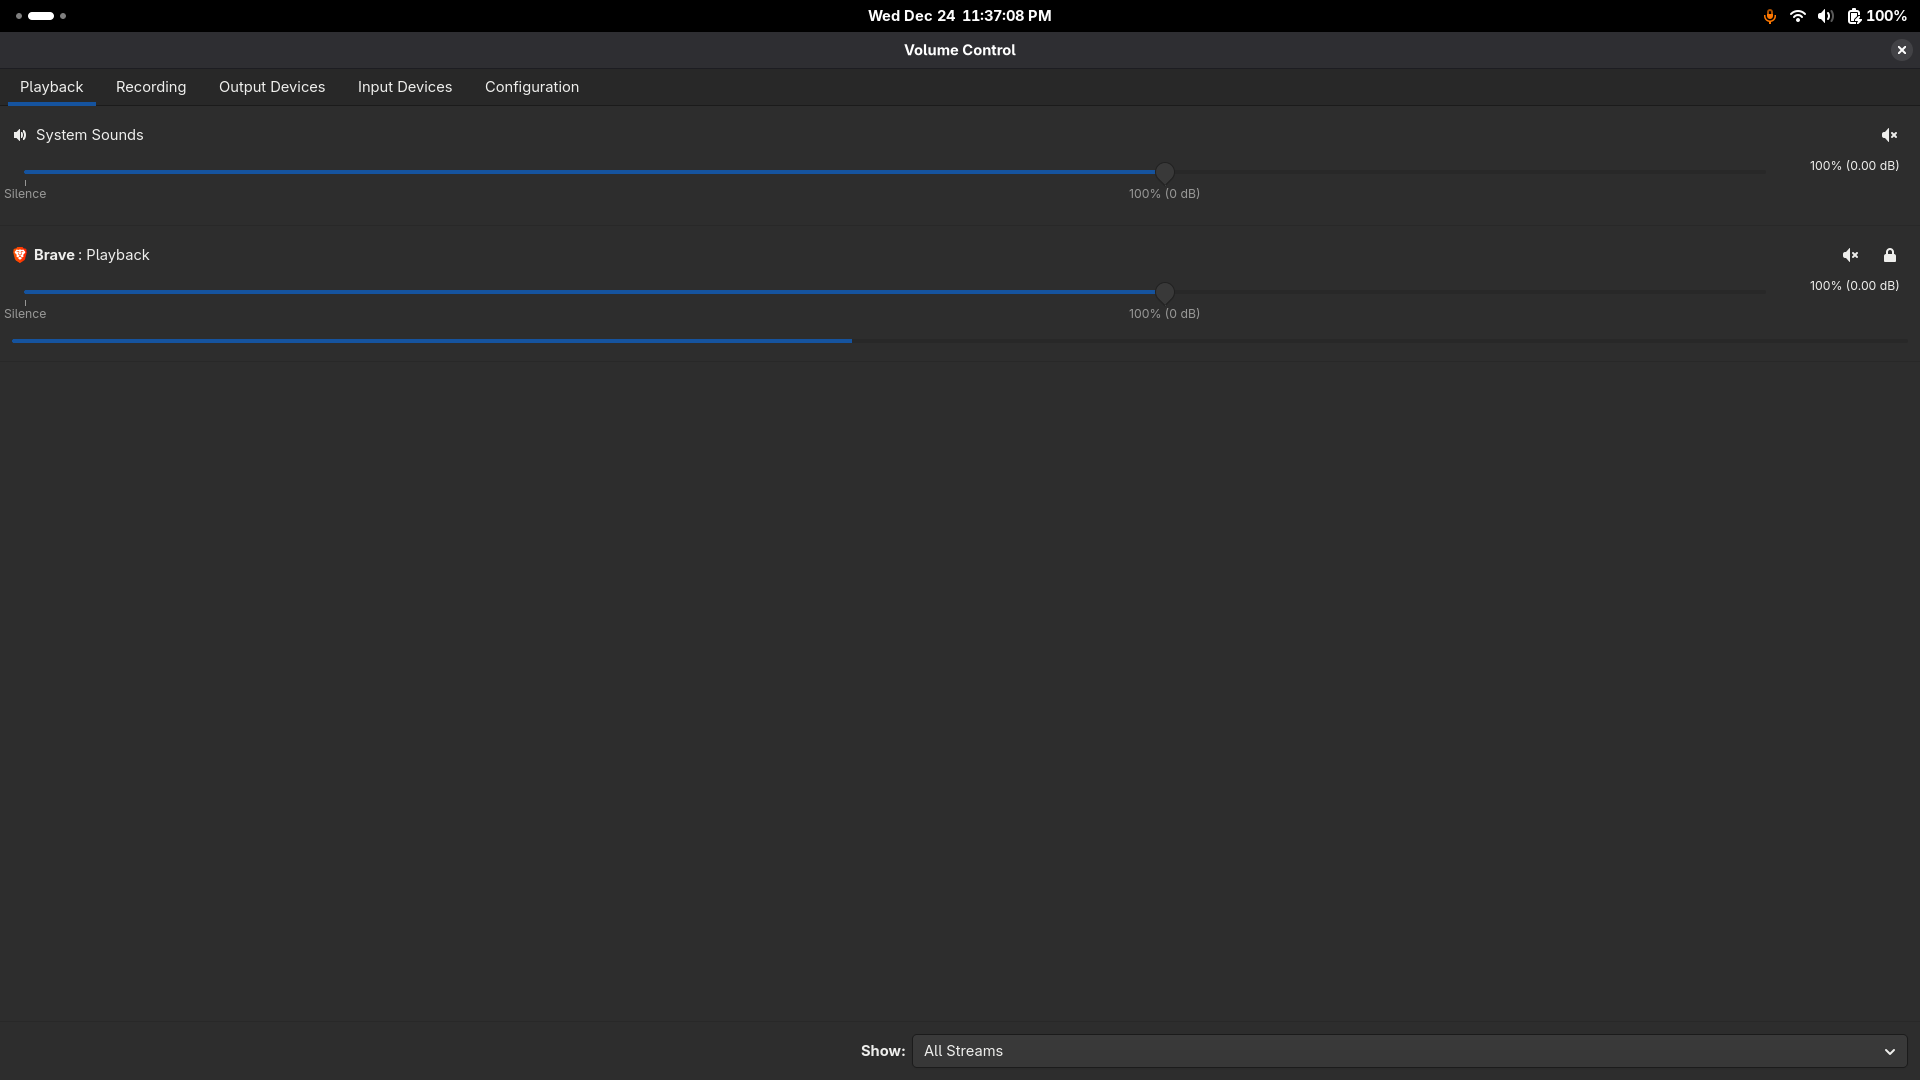
pavucontrol: Visual Audio Control
pavucontrol provides a graphical interface for:
- Selecting input/output devices
- Monitoring live audio levels
- Adjusting volume per application
- Routing audio streams
To verify microphone input:
- Open pavucontrol
- Go to the “Input Devices” tab
- Speak into your microphone
- Watch for movement in the volume meter
If the meter moves, your microphone is receiving input.
Here’s how it appears
Little tip, set a desktop executable icon for it, to avoid running it always from the terminal.
Here’s how:
1.Create in system location
nano ~/.local/share/applications/pavucontrol.desktop
Then enter these lines and their paths
[Desktop Entry]
Version=1.0
Type=Application
Name=Audio Mixer
Comment=PulseAudio/PipeWire Volume Control
Exec=pavucontrol
Icon=/home/gr3ytrac3/Pictures/desktop-images/raggedy-mic-7761515_640.png
Terminal=false
Categories=AudioVideo;
StartupNotify=true
Please make sure you download an image you’ll set as the desktop icon. Save it in a special folder you might want to be using for all the commands and tools you would be using more frequently.
Make sure to use the correct image path.
Once you’re done,
2.Update database
update-desktop-database ~/.local/share/applications/
3.Copy to desktop for quick access
cp ~/.local/share/applications/pavucontrol.desktop ~/Desktop/
4.Make desktop version trusted
chmod +x ~/Desktop/pavucontrol.desktop
gio set ~/Desktop/pavucontrol.desktop metadata::trusted true
What Should Happen Now
✅ Desktop icon → Double-click works
✅ Application menu → Searchable as “Audio Mixer”
✅ Terminal gtk-launch pavucontrol
✅ System integration → Can pin to taskbar/favorites
If it still doesn’t Work check your desktop environment’s specific behavior
Desktop icons might be disabled by default. You may need to install desktop icons extension
Ubuntu
sudo apt install gnome-shell-extension-desktop-icons-ng
Conclusion
Debugging audio on Linux can feel Impenetrable until you approach it systematically. By breaking the problem down layer by layer — from ALSA to PipeWire — and validating each step with the right tools, audio issues become far easier to understand and resolve.
The key takeaway from this write-up is not a single command or configuration, but a mindset: verify inputs, observe outputs, and rely on measurable evidence instead of assumptions. Tools like pw-record, pw-play, and qpwgraph make it possible to confirm what is actually happening in the audio stack, rather than guessing where things might be going wrong.
Once you can reliably test, visualize, and confirm microphone behavior, audio debugging stops being trial-and-error and becomes a repeatable process. That foundation is what makes troubleshooting faster, more predictable, and far less frustrating.
What started as a visual experiment revealed something deeper — sound on Linux is not just output, it is a live data surface.
In the next article, I’ll step beyond visualization and explore how audio paths can be observed, abused, and defended — using a real multi-VM simulation on KVM/QEMU.